User Guide
Part II Professional Characteristics
You could use the professional characteristic functions built in EPS to simplify data-processing and visualization. Data filter, data calculating, and graph design etc. could be completed efficiently in EPS.
Transpose and Rearrange
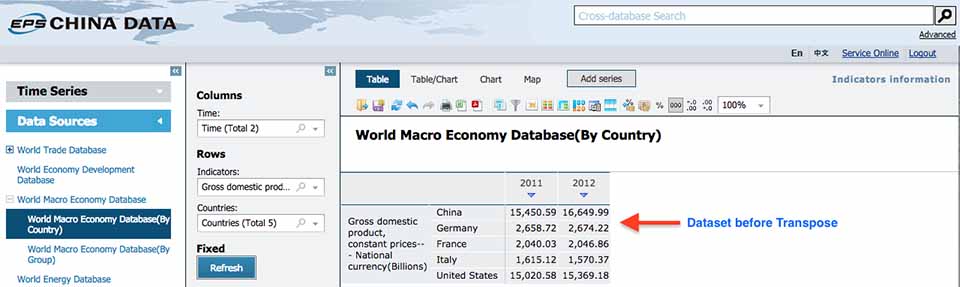
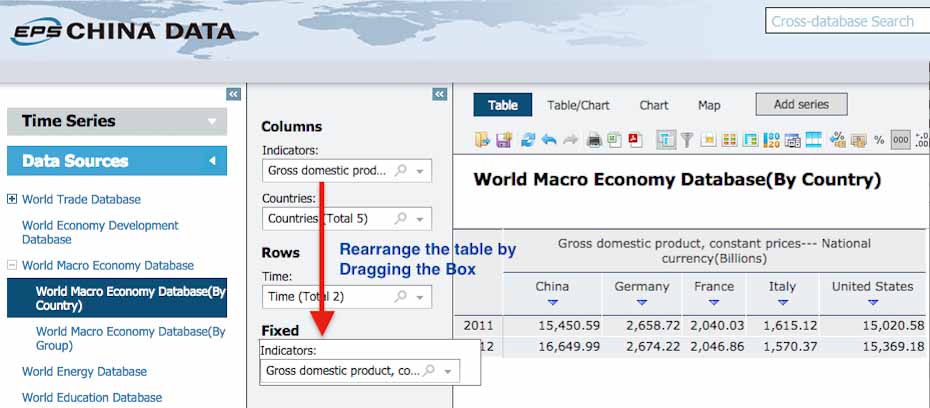
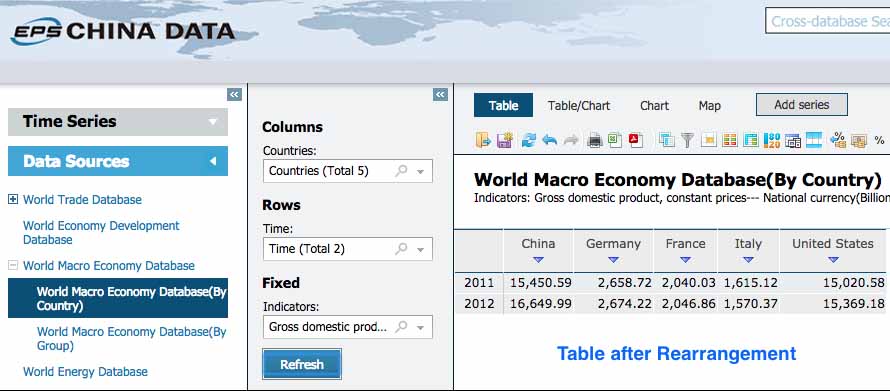
In the data table view, you could transpose the columns and rows of the data table (chart) by clicking the icon ![]() . You could also rearrange the item in the columns and rows by simply dragging it into the column, row or fixed area.
. You could also rearrange the item in the columns and rows by simply dragging it into the column, row or fixed area.
![]()
Data Filter
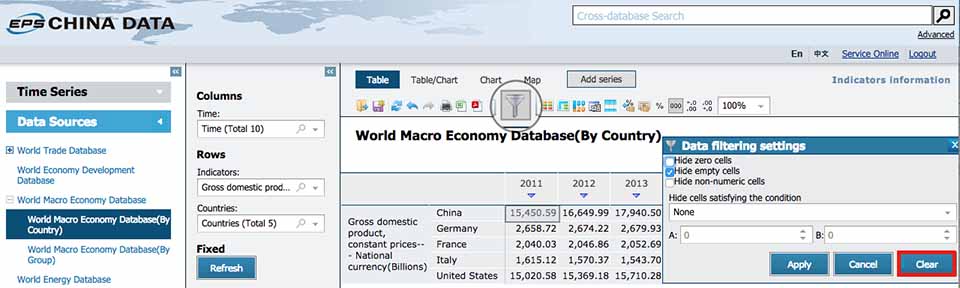
You can subset the data by setting the filter criteria, such as Hide the zero cells, Hide cells satisfying certain conditions. Clicking  and
and ![]() will clear the filter criteria.
will clear the filter criteria.
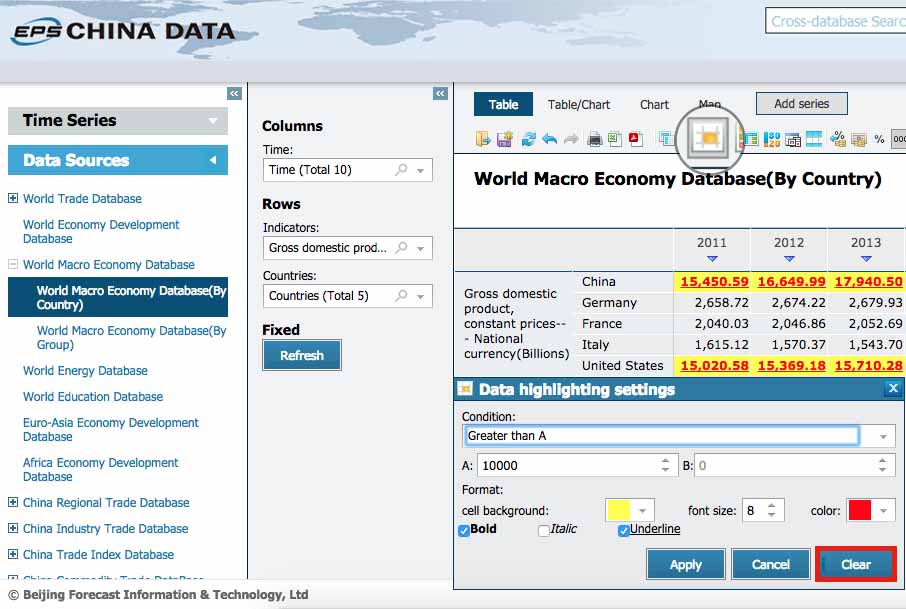
Highlight
You could highlight the data in order to focus on the data of your interest when the dataset is quite large. First you set a certain criteria, and decide how to display the highlighted area by setting the color, size and style of the font and the background of the cells. Click  again and choose
 ![]() to go back to the original dataset.
to go back to the original dataset.
Conditional Formatting
You could change the color style of the table or add icons to mark the value of the data according to a certain order (ascending or descending) by clicking  . This will help you quickly recognize how data change. Besides, you could use both color and icons to mark.
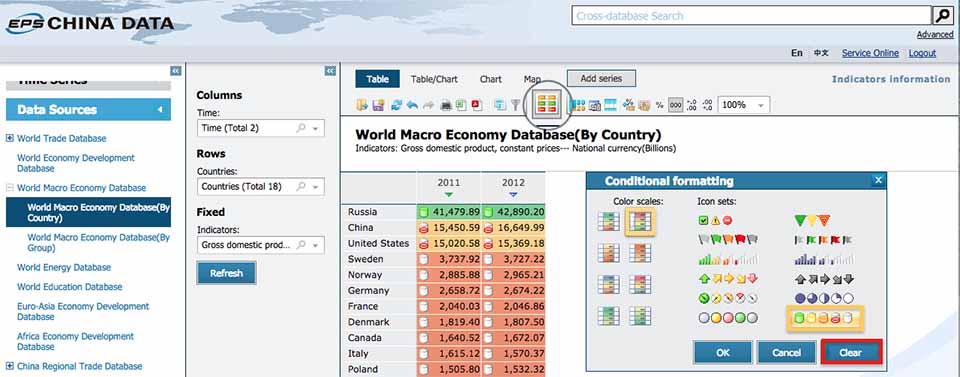
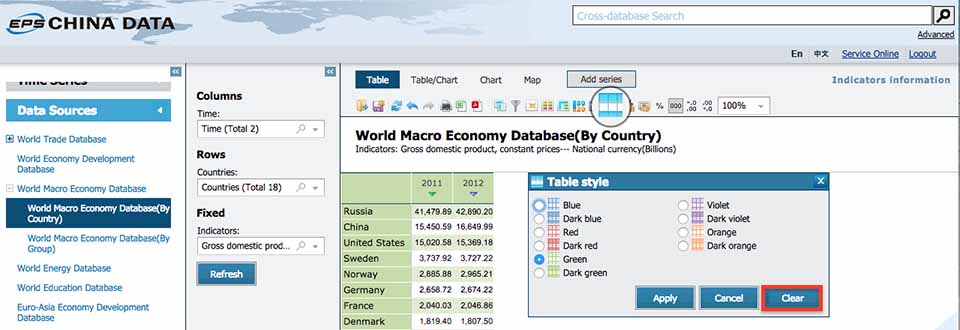
Table Style
You could personalize the table style by clicking  . The color schemes available are displayed below.
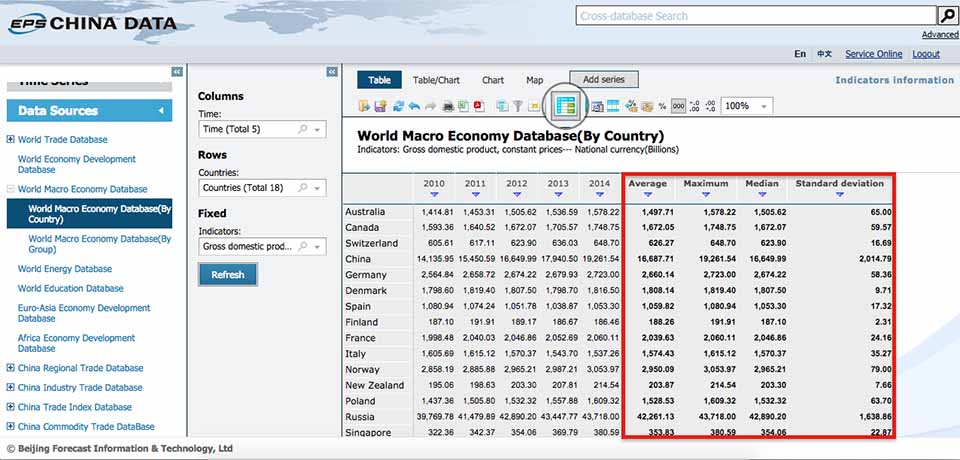
Data Calculator
Descriptive statistics of the data could be computed by column or row using column-wise and row-wise data computing function respectively. The descriptive statistics could be computed in EPS are shown in the figure below. You could also save the results as  . If you would like to remove the results, click
  again and
 ![]() .
.

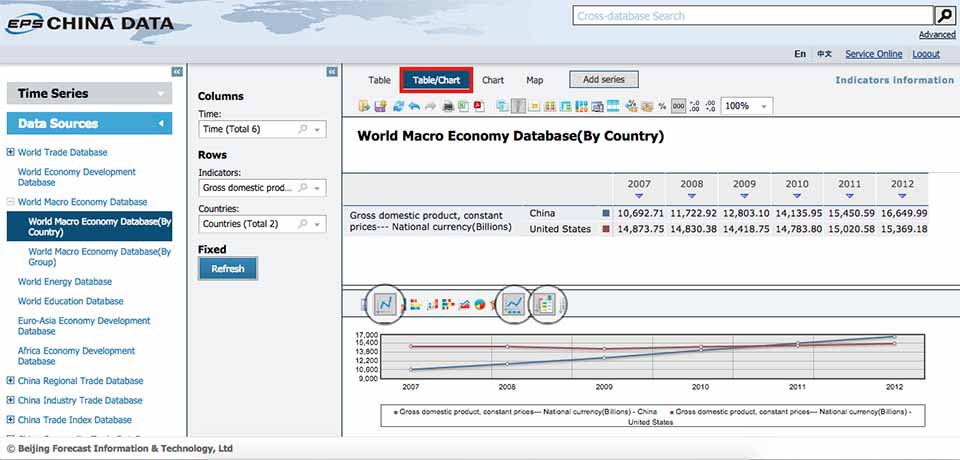
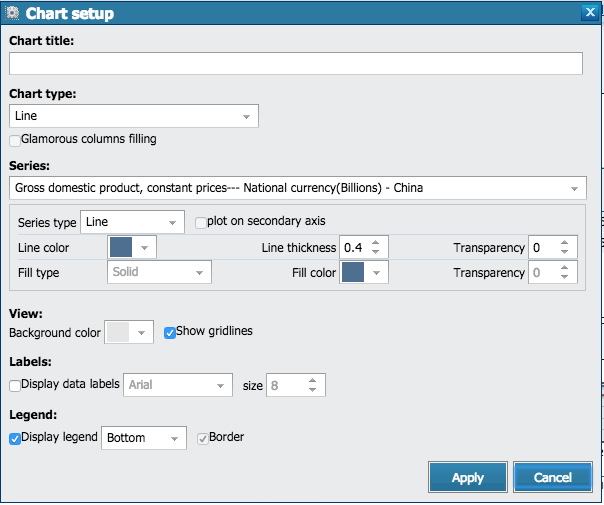
Graphs
You could use various graphs to visualize the data. The types of graphs include 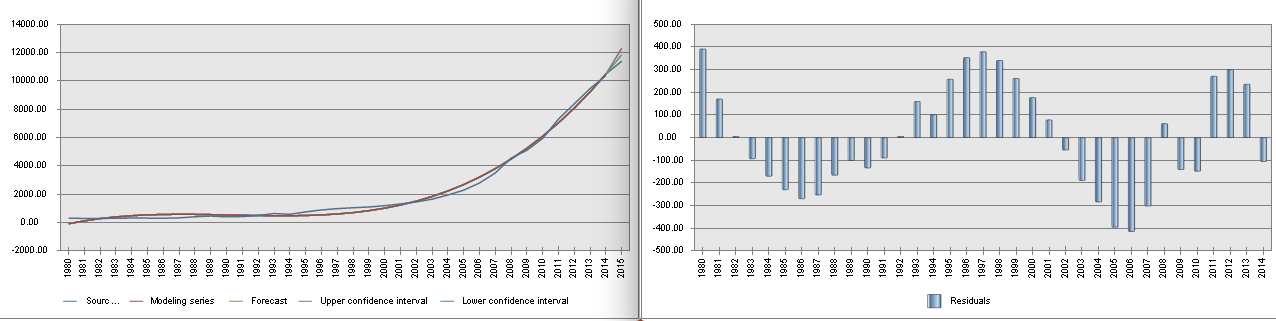 and so on. Figure title, labels of the data and axes, colors of the chart and more graphical elements could be adjusted and refined by clicking
  and setting the parameters as your desire.
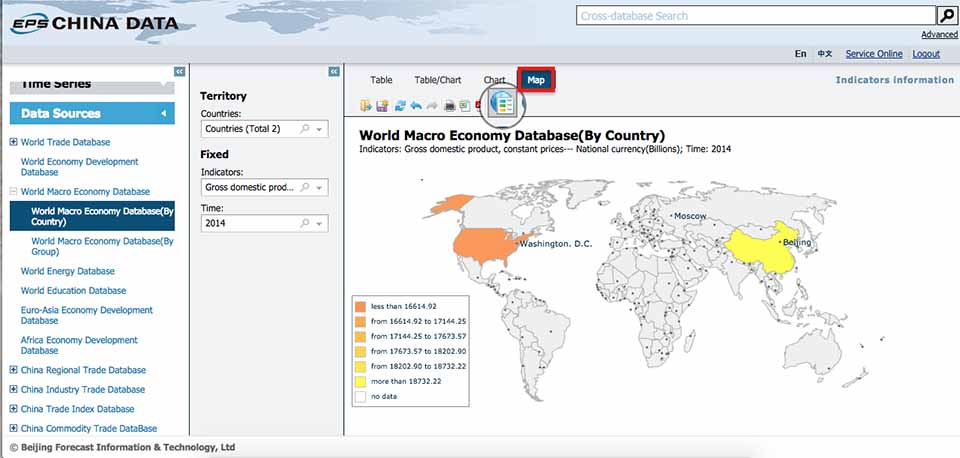
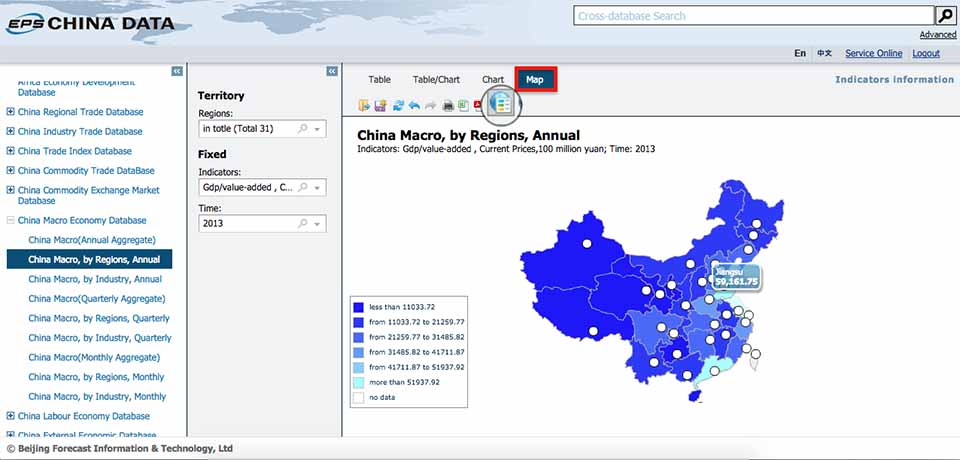
Digital Map
Digital map is an intuitive way to help you quickly learn how the data change across countries or regions worldwide, provinces or states in a certain country. And you could change the colors in the map by clicking  .
.
Previous Guide: Basic Functions
Next Guide: Statistical Analysis and Forecasty