User Guide
Part III Statistical Analysis and Forecast
Statistical analysis and forecast system provided by EPS is a powerful open platform to do statistical analysis online.
80-20 Rule (Pareto Principle)
The Pareto principle, also known as the 80–20 rule, states that, for many events, roughly 80% of the effects come from 20% of the causes. It is a common rule of thumb in business; e.g., "80% of your sales come from 20% of your clients." Therefore, many businesses have an easy access to dramatic improvements in profitability by focusing on the most effective areas and eliminating, ignoring, automating, delegating or retraining the rest, as appropriate.
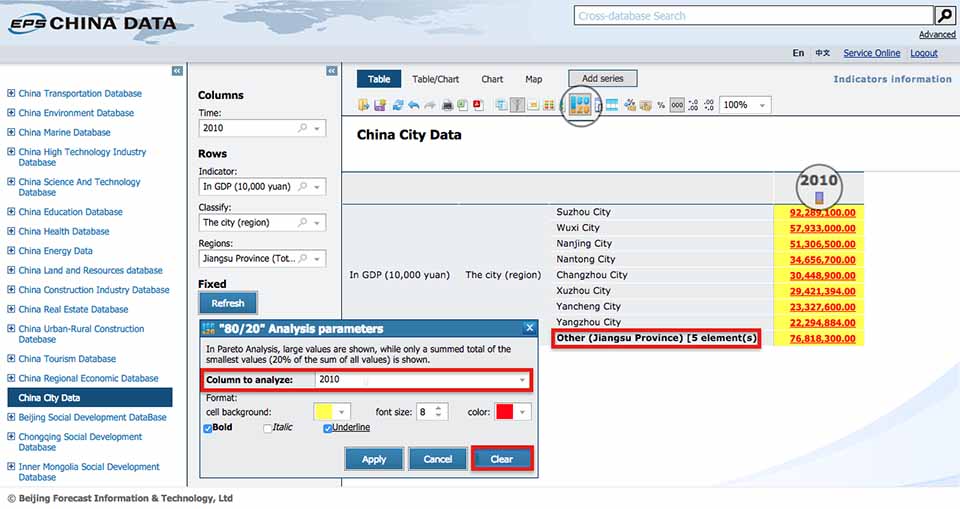
• Objective: Suppose we would like to know which cities play important roles in the economic development of Jiangsu in 2010.
• Data: We choose GDP of the cities in Jiangsu as the indicator. So we go to  to obtain the dataset.
• 80/20: Click  , and then choose the column
  . Note that the size, format and color of font and background color could be changed according to your preference.
• Conclusion: As you can see, the data in this column are sorted in descending order. Furthermore, the cities, whose GDP in total account for the top 80% of the total GDP are listed, while the rest cities accounting for the bottom 20% of the total GDP are aggregated, with the sum of their GDP shown in one cell. Since the first eight cities like Suzhou, Wuxi and Nanjing etc. contribute 80% to the total GDP, therefore, much more attention should be paid on these cities to keep the rapid economic development of Jiangsu.
Statistical Analysis and Forecast
You can do statistical analysis and forecast by clicking  . The statistical methods provided by EPS include:

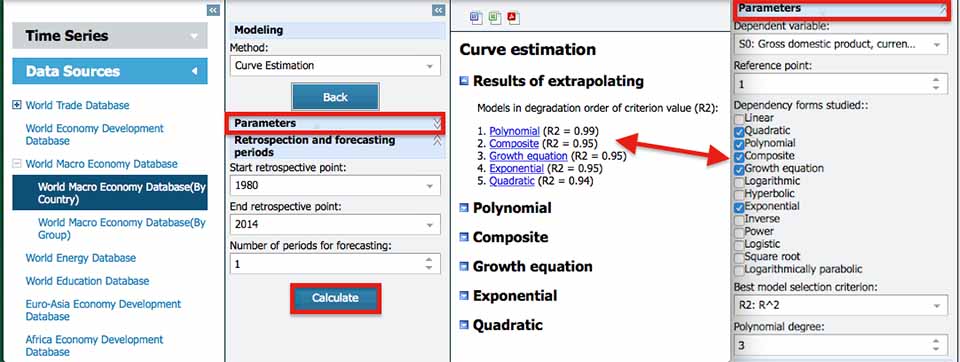
• Objective Suppose we would like to predict the GDP of China in 2015. One alternative modeling method is Curve Estimation.
• Data Choose  , and then look up the indicator Gross domestic product
• Curve Estimation Choose Curve Estimation, and then set the dependent variables, form of the function, best model selection criterion, polynomial degree, retrospection and forecasting periods. 1 is assigned to the number of periods here for forecasting, since the end retrospective point is 2014 and we would like to forecast the GDP in 2015. At last, click the  button.
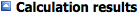
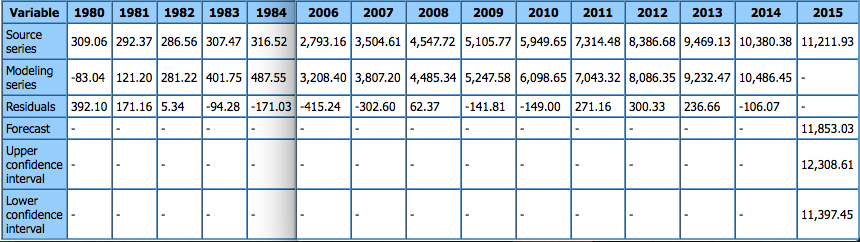
• Outputs The outputs include the estimates of the coefficients in the model, predicted value of the dependent variables, residuals and summary statistics such as Durbin-Watson Test Statistic, Fisher Statistic Value and Probability, Akaike Information Criterion, Schwarz Information Criterion and so on for statistical significance test or model comparison. Except for the statistics, the plots of predicted value and residuals will also be produced for you to decide whether the model fits the data well.
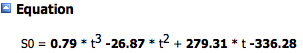
• As you can see, the Polynomial model has the best fit with . Therefore, we pick the Polynomial model and display the results.
Note: For more detailed interpretation of the statistical methods and their applications, please refer to the case studies posted on the official website of EPS.
Time Series Analysis
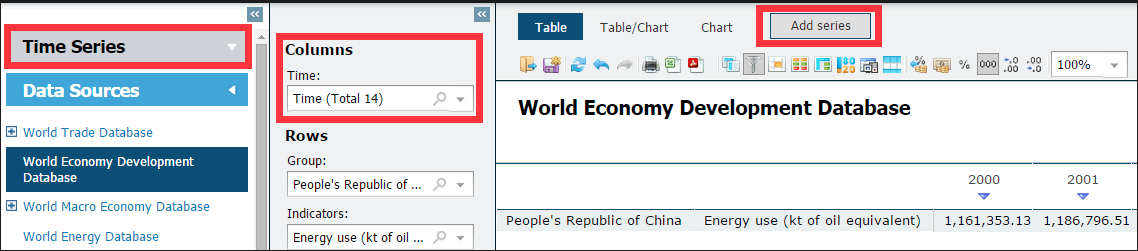
There is a module specialized for time series analysis in EPS. Indicators from different databases are allowed to be put together in a single dataset for further analysis.
1. How to add the data to the time series analysis module
• Select the data first in the table view and click  .
.
• A dialog box would pop up while you successfully add the selected time series to dataset in the time series analysis module.
• Clicking  on the top-left corner of the webpage would take you to the Time Series Analysis Module.
2. Data-processing and statistical analysis methods in Time Series Analysis Module
After entering the Time Series Analysis Module, the names of series you have selected would be listed in the second column. Besides, deleting or renaming those series are available.
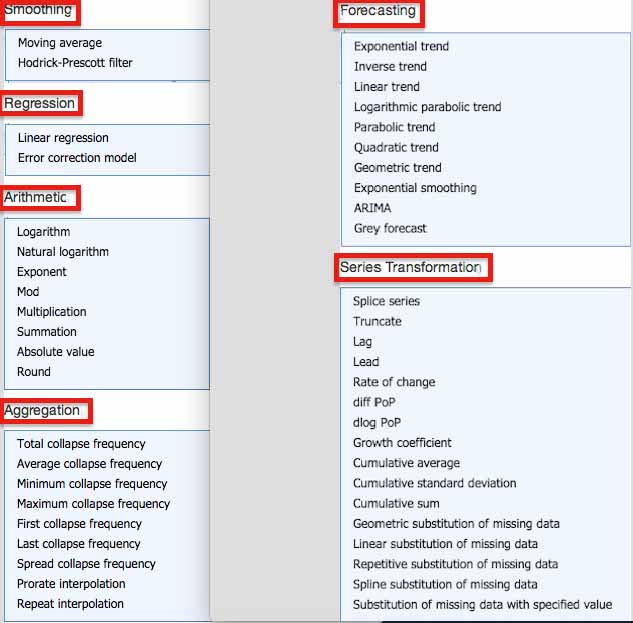
All the statistical analysis and forecast methods, data visualization methods and basic functions mentioned before are still accessible, activated by clicking the corresponding icons. More powerful data-processing and statistical modeling methods could be found by right-click on the series displayed in the table view in the Time Series Analysis Module. They are:

Previous Guide: Characteristic Functions