User Guide
Part I Introduction
EPS provides not only more than 40 databases covering a wide range of industries, but a powerful online statistical analysis system for you to get and then analyze the data seamlessly. This manual is the first part of the user guide to help you to get familiar with EPS quickly.
Log in
Two steps to log in
1. Go to the official website of EPS;
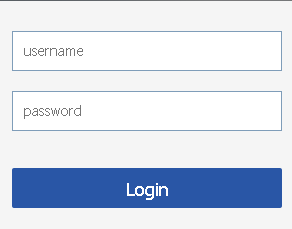
2. Click the  on the upper right corner of the homepage. When asked, input your user name and password and then click Login.
Please note that
• if you choose this way to log in, you will enter EPS with a default database selected and a corresponding dataset displayed on the screen;
• users on campus will log in with the IP assigned to your universities automatically after you click on the upper right corner of the homepage. However, if you would like to log in with IP out of campus, please contact the librarians in your university for help.
Search the Database
Two ways to search the database: search within a single database and search across multiple databases.
1. Search across multiple databases
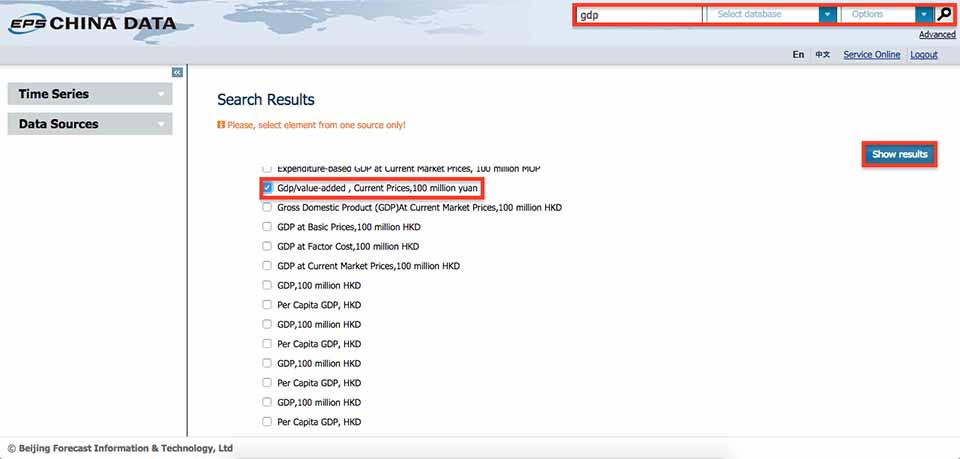
A search bar would appear on the top-right corner of the webpage after a successful login. Key in the name or the keyword of the indicator. For example, suppose you would like to search the GDP/value-added of 31 provinces in China. Note that you want the data grouped by province, therefore you may start from the database China Macro, by Regions, Annual.
• Key in the keyword gdp in the search bar on the top-right corner.
• All the indicators including the keyword gdp would be returned.
• Find and then tick in the box on the left of the target indicator. Here, you may select GDP/value-added.
• Click Show results to redirect to the database including the indicator you have selected. Besides, the data will be displayed simultaneously.
2. Search within a single databases
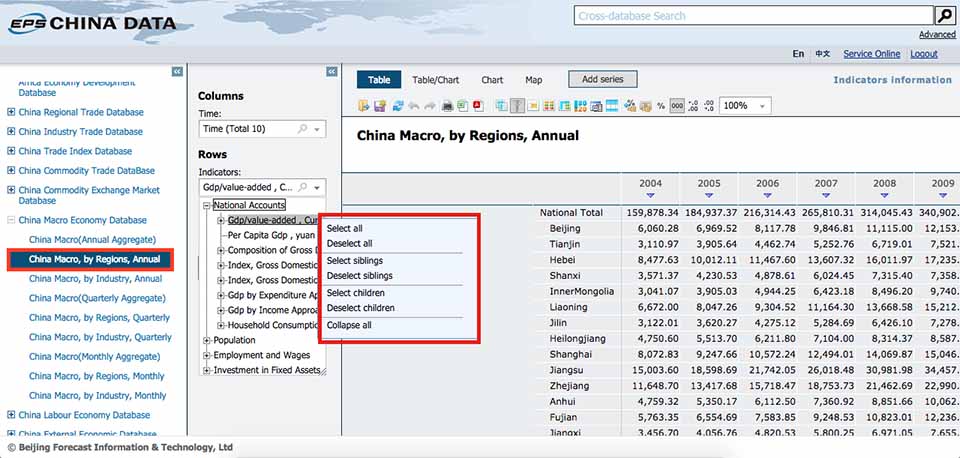
EPS provides more than 40 professional databases. Three columns would appear on the screen after you log in. You just need to click on the database name listed in the first column and then look up the indicator in the second column. You could also key in the keyword of the indicator in the search bar below the Indicators to facilitate the search.
Tips: You could also right click in the combo box to use the selection shortcuts such as Select all, Deselect all, Select Siblings etc., to make selection easier.
Save and Download
1. Save your filter criteria specified
You could click  to save your filter criteria and
  to reload or reuse them whenever you come back to EPS.
2. Download the dataset
You could download and save the dataset as  in the data table view, and save the outputs of Statistical Analysis or Time Series Analysis as
  .
.
3. Print the dataset
Click  to print.
Help
All suggestions and comments regarding to our work are welcome and appreciated. Feel free to contact us by sending Email.
Next Guide: Characteristic Functions